Playback starts YouTube’s embedded player (privacy-enhanced mode).
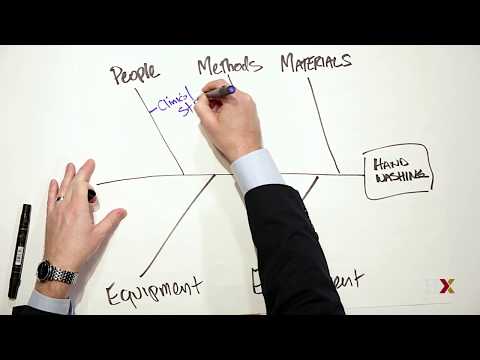
How to create cause-and-effect diagrams
ChannelHarvardXDescription from the creator
Learn how to create a cause-and-effect diagram, also known as an Ishikawa or "fishbone" diagram, to explore and display the possible causes of a certain effect.
From our free online course, “Practical Improvement Science in Health Care: A Roadmap for Getting Results”:
edx.org/course/ph556x-practical-improvement-sci…
— Subscribe to our channel: youtube.com/channel/UCKJyv_uNh3LhYFKmwaB63bA?su…
— Sign up for emails about new courses: harvardx.link/email
— HarvardX courses on edX: edx.org/school/harvardx
— Harvard University's online courses: online-learning.harvard.edu/
HarvardX empowers the faculty of Harvard University to create high-quality online courses in subjects ranging from computer science to history, education, and religion.
From our free online course, “Practical Improvement Science in Health Care: A Roadmap for Getting Results”:
edx.org/course/ph556x-practical-improvement-sci…
— Subscribe to our channel: youtube.com/channel/UCKJyv_uNh3LhYFKmwaB63bA?su…
— Sign up for emails about new courses: harvardx.link/email
— HarvardX courses on edX: edx.org/school/harvardx
— Harvard University's online courses: online-learning.harvard.edu/
HarvardX empowers the faculty of Harvard University to create high-quality online courses in subjects ranging from computer science to history, education, and religion.
About this tutorial
HarvardX published this 3:17 video tutorial on November 9, 2017. It has been watched 767,884 times on YouTube.
Tags
Share
This tutorial in other languages
- FRComment créer des diagrammes de cause à effet
- ESCómo crear diagramas de causa y efecto
- PTComo criar diagramas de causa e efeito
- ITCome creare diagrammi causa-effetto
- DEWie Ursache-Wirkungs-Diagramme erstellen
- NLHoe te oorzaak-gevolg diagrammen
- RUКак создать причинно-следственные диаграммы
- PLJak tworzyć diagramy przyczynowo-skutkowych
- JA因果ダイアグラムを作成する方法
- ARكيفية إنشاء مخططات السبب والنتيجة
- HIकारण और प्रभाव आरेख बनाने के लिए कैसे
- IDCara membuat diagram sebab-akibat