Playback starts YouTube’s embedded player (privacy-enhanced mode).
How to normalize and correct FTIR and UV-VIS spectra in Origin
ChannelSAYPhysicsChapters
Description from the creator
Learn how to plot and normalize FTIR and UV-Vis data in OriginPro.
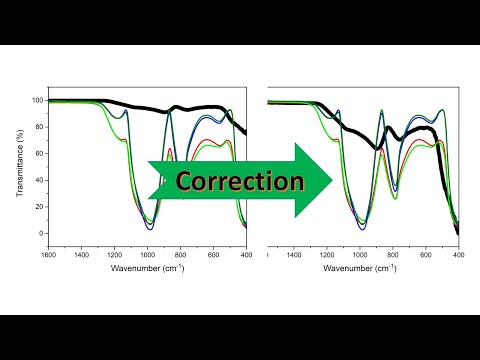
This tutorial covers introduction to normalizing FTIR and UV-Vis data, correct FTIR data by normalizing it, identify and address FTIR data issues, and normalize FTIR data from 0 to 100.
Exercise Files (Origin Files):
drive.google.com/file/d/1stR9UykNcZ30KVZzDglik1…
drive.google.com/file/d/1wrLk66pH5_QxSROqZVup05…
0:00 - Introduction to Normalizing FTIR and UV-Vis Data in Origin
0:05 - How to Correct FTIR Data by Normalizing It in Origin
0:14 - How to Identify and Address FTIR Data Issues in Origin
1:01 - How to Normalize FTIR Data from 0 to 100 in Origin
2:00 - How to Shift FTIR Data to Align Profiles in Origin
3:12 - How to Correct FTIR Data Peaks Using Normalization in Origin
4:01 - How to Normalize UV-Vis Data to Improve Data Accuracy in Origin
4:11 - How to Adjust UV-Vis Data for Accurate Plotting in Origin
5:00 - How to Normalize Y-Axis of UV-Vis Data for Clearer Graphs in Origin
5:32 - How to Apply Scaling and Adjust UV-Vis Legends in Origin
6:00 - How to Finalize and Validate Corrected FTIR and UV-Vis Data in Origin
In this Youtube video, viewers will learn how to plot and normalize FTIR and UV-VIS data using Origin software. The video will provide step-by-step instructions on how to import and organize the data in Origin, and how to create plots with appropriate labeling and formatting. The video will also cover the process of normalization, which is essential for comparing data sets with different intensities or baselines. Viewers will learn how to apply normalization techniques to their data, such as dividing by a reference spectrum or subtracting a baseline, and how to interpret the resulting plots. By the end of the video, viewers will have a clear understanding of how to use Origin software to plot and analyze FTIR and UV-VIS data, which is essential for many applications in chemistry, materials science, and other fields.
How to normalize and correct FTIR and UV-VIS spectra in Origin, FTIR data normalization, ftir data correction in origin, normalize data in origin, data normalization in origin
There are various ways for baseline creation. You can generate baseline anchor points automatically or manually and then connect them with interpolation or fit them with a function.
How to create baseline with 2nd Derivative method
How to create baseline with Asymmetric Least Squares (ALS) Method (Pro)
How to subtract a baseline from the spectrum
how to plot ftir data in origin
normalizing, baseline correction, smoothing, peak pick and area
how to normalise and stack xrd plots in origin 9
origin 8: analyze peak and baseline data with the quick peaks gadget
baseline correction using origin
working with raman spectra in origin
origin 9.1: dragging to change spectrum offsets on a graph
how to smooth data (xrd) using origin software
curve fitting: introduction to curve fitting
#OriginPro #MaterialsScience #SAYPhysics
This tutorial covers introduction to normalizing FTIR and UV-Vis data, correct FTIR data by normalizing it, identify and address FTIR data issues, and normalize FTIR data from 0 to 100.
Exercise Files (Origin Files):
drive.google.com/file/d/1stR9UykNcZ30KVZzDglik1…
drive.google.com/file/d/1wrLk66pH5_QxSROqZVup05…
0:00 - Introduction to Normalizing FTIR and UV-Vis Data in Origin
0:05 - How to Correct FTIR Data by Normalizing It in Origin
0:14 - How to Identify and Address FTIR Data Issues in Origin
1:01 - How to Normalize FTIR Data from 0 to 100 in Origin
2:00 - How to Shift FTIR Data to Align Profiles in Origin
3:12 - How to Correct FTIR Data Peaks Using Normalization in Origin
4:01 - How to Normalize UV-Vis Data to Improve Data Accuracy in Origin
4:11 - How to Adjust UV-Vis Data for Accurate Plotting in Origin
5:00 - How to Normalize Y-Axis of UV-Vis Data for Clearer Graphs in Origin
5:32 - How to Apply Scaling and Adjust UV-Vis Legends in Origin
6:00 - How to Finalize and Validate Corrected FTIR and UV-Vis Data in Origin
In this Youtube video, viewers will learn how to plot and normalize FTIR and UV-VIS data using Origin software. The video will provide step-by-step instructions on how to import and organize the data in Origin, and how to create plots with appropriate labeling and formatting. The video will also cover the process of normalization, which is essential for comparing data sets with different intensities or baselines. Viewers will learn how to apply normalization techniques to their data, such as dividing by a reference spectrum or subtracting a baseline, and how to interpret the resulting plots. By the end of the video, viewers will have a clear understanding of how to use Origin software to plot and analyze FTIR and UV-VIS data, which is essential for many applications in chemistry, materials science, and other fields.
How to normalize and correct FTIR and UV-VIS spectra in Origin, FTIR data normalization, ftir data correction in origin, normalize data in origin, data normalization in origin
There are various ways for baseline creation. You can generate baseline anchor points automatically or manually and then connect them with interpolation or fit them with a function.
How to create baseline with 2nd Derivative method
How to create baseline with Asymmetric Least Squares (ALS) Method (Pro)
How to subtract a baseline from the spectrum
how to plot ftir data in origin
normalizing, baseline correction, smoothing, peak pick and area
how to normalise and stack xrd plots in origin 9
origin 8: analyze peak and baseline data with the quick peaks gadget
baseline correction using origin
working with raman spectra in origin
origin 9.1: dragging to change spectrum offsets on a graph
how to smooth data (xrd) using origin software
curve fitting: introduction to curve fitting
#OriginPro #MaterialsScience #SAYPhysics
About this tutorial
SAYPhysics published this 5:50 video tutorial on April 25, 2020. It has been watched 45,279 times on YouTube.
- Channel
- SAYPhysics
- Category
- Education
- Duration
- 5:50
- Published
- April 25, 2020
- Views
- 45,279
- Likes
- 326
Tags
Share
This tutorial in other languages
- FRComment normaliser et corriger FTIR et UV-VIS spectres origine
- ESCómo normalizar y correcta FTIR y UV-VIS en Origen
- PTComo normalizar e correta FTIR e UV-Vis em Origem
- ITCome normalizzare e correggere FTIR e UV-VIS spettri in origine
- DEWie zu normalisieren und die korrekte FTIR und UV-VIS-Spektren in Origin
- NLHoe te normaliseren en correcte FTIR en UV-VIS spectra in Origin
- RUКак нормализовать и правильно ИК и УФ-VIS спектры в Origin
- PLJak znormalizować i prawidłowe FTIR i UV-VIS Widma w Origin
- JAUV-VISスペクトル起源で正規化し、正しいFTIRとする方法
- ARكيفية تطبيع والصحيح FTIR وUV-VIS الأطياف في المنشأ
- HIसामान्य बनाने में कैसे और सही एफटीआईआर और यूवी तुलना उत्पत्ति में स्पेक्ट्रा
- IDBagaimana untuk menormalkan dan benar FTIR dan UV-VIS spektrum di Negara Asal