Playback starts YouTube’s embedded player (privacy-enhanced mode).
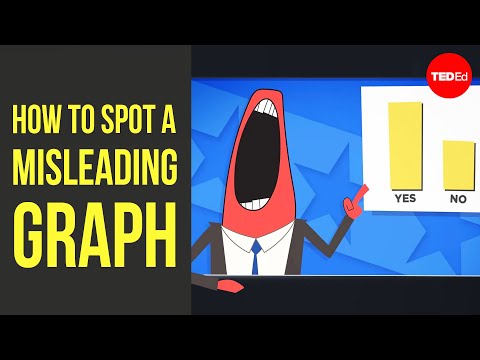
How to spot a misleading graph - Lea Gaslowitz
ChannelTED-EdIn brief
You’ll learn to critically read graphs and spot common tricks that distort data. Lea Gaslowitz breaks down visual manipulation techniques so you can question what you see in news, reports, or presentations.
Description from the creator
View full lesson: ed.ted.com/lessons/how-to-spot-a-misleading-gra…
When they’re used well, graphs can help us intuitively grasp complex data. But as visual software has enabled more usage of graphs throughout all media, it has also made them easier to use in a careless or dishonest way — and as it turns out, there are plenty of ways graphs can mislead and outright manipulate. Lea Gaslowitz shares some things to look out for.
Lesson by Lea Gaslowitz, directed by Mark Phillips.
When they’re used well, graphs can help us intuitively grasp complex data. But as visual software has enabled more usage of graphs throughout all media, it has also made them easier to use in a careless or dishonest way — and as it turns out, there are plenty of ways graphs can mislead and outright manipulate. Lea Gaslowitz shares some things to look out for.
Lesson by Lea Gaslowitz, directed by Mark Phillips.
About this tutorial
TED-Ed published this 4:10 video tutorial on October 27, 2017. It has been watched 3,805,599 times on YouTube.
Tags
Share
This tutorial in other languages
- FRComment repérer un graphique trompeur - Lea Gaslowitz
- ESCómo detectar una gráfica engañosa - Lea Gaslowitz
- PTComo identificar um gráfico enganosa - Lea Gaslowitz
- ITCome individuare un grafico fuorviante - Lea Gaslowitz
- DEWie eine irreführende Diagramm erkennen - Lea Gaslowitz
- NLHoe te herkennen van een misleidende grafiek - Lea Gaslowitz
- RUКак обнаружить в заблуждение граф - Lea Gaslowitz
- PLJak rozpoznać mylące wykres - Lea Gaslowitz
- JAリーGaslowitz - 誤解を招くようなグラフを発見する方法
- ARكيفية اكتشاف الرسم البياني مضللة - ليا Gaslowitz
- HIएक भ्रामक ग्राफ स्थान कैसे - Lea Gaslowitz
- IDCara mengidentifikasi grafik menyesatkan - Lea Gaslowitz