Playback starts YouTube’s embedded player (privacy-enhanced mode).
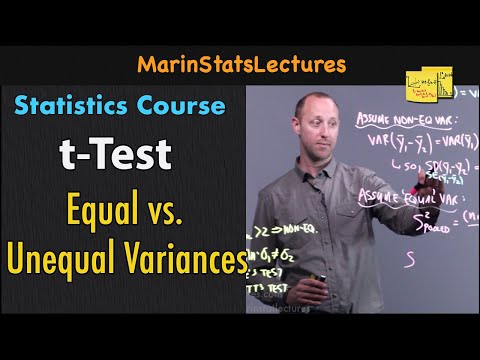
Two Sample t-Test:Equal vs Unequal Variance Assumption| Statistics Tutorial #24| MarinStatsLectures
ChannelMarinStatsLectures-R Programming & StatisticsDescription from the creator
Two Sample t-Test: Equal vs Unequal Variance Assumption: Learn about the assumption of equal variance (or standard deviation) vs non-equal variance (or standard deviation) in data analysis. To learn more about 2 Sample t-Test watch this goo.gl/MWLAua -and for conducting 2 Sample t-Test with R l goo.gl/rVzjyf👍🏼Best Statistics & R Programming Language Tutorials: ( goo.gl/4vDQzT )
►► Like to support us? You can Donate (bit.ly/2CWxnP2), Share our Videos, Leave us a Comment and Give us a Like! Either way We Thank You!
For more Statistics and R Programming Tutorials: goo.gl/4vDQzT - 2 Sample t-Test Tutorial goo.gl/MWLAua -2 Sample t-Test R Tutorial goo.gl/rVzjyf
In this statistics tutorial, we learn about the assumption of equal variance (or standard deviation) vs non-equal variance (or standard deviation). When working with the 2 sample t-test, we must make one of those two assumptions. We also learn how to decide if we can assume equal variance or if we should assume unequal variance. We cover making this decision both in a subjective way, as well as describing more formal tests that can be used. Assuming equal variance is also referred to as 'pooling', or a 'pooled estimate' of the variance. This video also shows how to calculate the standard error for the difference in means under each of the assumptions, although the focus is on what each assumption means, in concept, and not on the calculations.
►► Watch More:
► Statistics Course for Data Science bit.ly/2SQOxDH
►R Course for Beginners: bit.ly/1A1Pixc
►Getting Started with R using R Studio (Series 1): bit.ly/2PkTneg
►Graphs and Descriptive Statistics in R using R Studio (Series 2): bit.ly/2PkTneg
►Probability distributions in R using R Studio (Series 3): bit.ly/2AT3wpI
►Bivariate analysis in R using R Studio (Series 4): bit.ly/2SXvcRi
►Linear Regression in R using R Studio (Series 5): bit.ly/1iytAtm
►ANOVA Statistics and ANOVA with R using R Studio : bit.ly/2zBwjgL
►Hypothesis Testing Videos: bit.ly/2Ff3J9e
►Linear Regression Statistics and Linear Regression with R : bit.ly/2z8fXg1
Follow MarinStatsLectures
Subscribe: goo.gl/4vDQzT
website: statslectures.com
Facebook: goo.gl/qYQavS
Twitter: goo.gl/393AQG
Instagram: goo.gl/fdPiDn
Our Team:
Content Creator: Mike Marin (B.Sc., MSc.) Senior Instructor at UBC.
Producer and Creative Manager: Ladan Hamadani (B.Sc., BA., MPH)
These videos are created by #marinstatslectures to support some statistics courses at the University of British Columbia (UBC) (#IntroductoryStatistics and #RVideoTutorials ), although we make all videos available to the everyone everywhere for free.
Thanks for watching! Have fun and remember that statistics is almost as beautiful as a unicorn!
#statistics #rprogramming
►► Like to support us? You can Donate (bit.ly/2CWxnP2), Share our Videos, Leave us a Comment and Give us a Like! Either way We Thank You!
For more Statistics and R Programming Tutorials: goo.gl/4vDQzT - 2 Sample t-Test Tutorial goo.gl/MWLAua -2 Sample t-Test R Tutorial goo.gl/rVzjyf
In this statistics tutorial, we learn about the assumption of equal variance (or standard deviation) vs non-equal variance (or standard deviation). When working with the 2 sample t-test, we must make one of those two assumptions. We also learn how to decide if we can assume equal variance or if we should assume unequal variance. We cover making this decision both in a subjective way, as well as describing more formal tests that can be used. Assuming equal variance is also referred to as 'pooling', or a 'pooled estimate' of the variance. This video also shows how to calculate the standard error for the difference in means under each of the assumptions, although the focus is on what each assumption means, in concept, and not on the calculations.
►► Watch More:
► Statistics Course for Data Science bit.ly/2SQOxDH
►R Course for Beginners: bit.ly/1A1Pixc
►Getting Started with R using R Studio (Series 1): bit.ly/2PkTneg
►Graphs and Descriptive Statistics in R using R Studio (Series 2): bit.ly/2PkTneg
►Probability distributions in R using R Studio (Series 3): bit.ly/2AT3wpI
►Bivariate analysis in R using R Studio (Series 4): bit.ly/2SXvcRi
►Linear Regression in R using R Studio (Series 5): bit.ly/1iytAtm
►ANOVA Statistics and ANOVA with R using R Studio : bit.ly/2zBwjgL
►Hypothesis Testing Videos: bit.ly/2Ff3J9e
►Linear Regression Statistics and Linear Regression with R : bit.ly/2z8fXg1
Follow MarinStatsLectures
Subscribe: goo.gl/4vDQzT
website: statslectures.com
Facebook: goo.gl/qYQavS
Twitter: goo.gl/393AQG
Instagram: goo.gl/fdPiDn
Our Team:
Content Creator: Mike Marin (B.Sc., MSc.) Senior Instructor at UBC.
Producer and Creative Manager: Ladan Hamadani (B.Sc., BA., MPH)
These videos are created by #marinstatslectures to support some statistics courses at the University of British Columbia (UBC) (#IntroductoryStatistics and #RVideoTutorials ), although we make all videos available to the everyone everywhere for free.
Thanks for watching! Have fun and remember that statistics is almost as beautiful as a unicorn!
#statistics #rprogramming
About this tutorial
MarinStatsLectures-R Programming & Statistics published this 14:34 video tutorial on November 13, 2018. It has been watched 91,763 times on YouTube.
- Category
- Education
- Duration
- 14:34
- Published
- November 13, 2018
- Views
- 91,763
- Likes
- 789
Tags
Share
This tutorial in other languages
- FRDeux échantillons t-Test: égalité vs Inégalité Variance Assomption | Statistiques Tutoriel # 24 | MarinStatsLectures
- ESDos muestras t-test: Igualdad vs desigual Varianza Asunción | Estadísticas Tutorial # 24 | MarinStatsLectures
- PTDuas Amostras t-Test: Equal vs desigual Variance Assunção | Estatísticas Tutorial # 24 | MarinStatsLectures
- ITDue campioni t-test: uguale vs disuguale Varianza Assunzione | Statistiche Tutorial # 24 | MarinStatsLectures
- DEZwei Stichproben-t-Test: Equal vs Ungleiche Variance Annahme | Statistik Tutorial # 24 | MarinStatsLectures
- NLTwee Sample t-Test: Gelijke vs Ongelijke Variantie Hemelvaart | Statistieken Tutorial # 24 | MarinStatsLectures
- RUДва образец Т-тест: Равный против неравного перерасхода Успенского | Статистика Tutorial # 24 | MarinStatsLectures
- PLDwie próbki t-Test: Równe vs Nierówne wariancyjne Wniebowzięcia | Statystyki Tutorial # 24 | MarinStatsLectures
- JA二標本t検定:不等分散昇天対イコール|統計チュートリアル#24 | MarinStatsLectures
- ARاثنين من عينة اختبار t: المساواة في مقابل عدم المساواة في الفروق العذراء | الاحصائيات دروس # 24 | MarinStatsLectures
- HIदो नमूना t- परीक्षण: बराबर बनाम असमान विचरण धारणा | सांख्यिकी ट्यूटोरियल # 24 | MarinStatsLectures
- IDDua Sample t-Test: Sama vs merata Variance Asumsi | Statistik Tutorial # 24 | MarinStatsLectures