Playback starts YouTube’s embedded player (privacy-enhanced mode).
Entity Relationship Diagram (ERD) Tutorial - Part 1
ChannelLucidchartIn brief
You’ll grasp the core of Entity Relationship Diagrams (ERDs) and learn to construct one with proper cardinality. This covers entities, attributes, and relationships, along with how to represent numerical connections between them. Perfect for beginners in database design or modeling.
Questions & answers
What are the three main components of an ERD?
Entities (objects/concepts), attributes (properties), and relationships (connections).
How does cardinality work in ERDs?
Symbols indicate the numerical range (minimum/maximum) of relationships between entities.
Description from the creator
WE'VE UPDATED THIS TUTORIAL! CHECK OUT THE NEWEST VERSION HERE: youtu.be/xsg9BDiwiJE
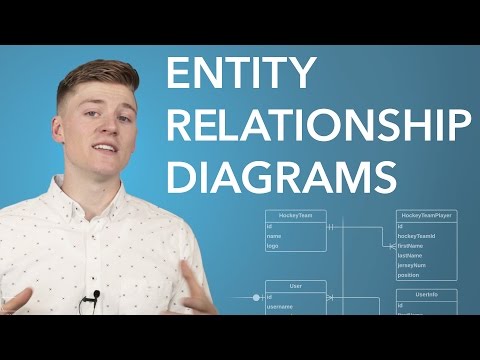
Learn how to create an Entity Relationship Diagram in this tutorial. We provide a basic overview of ERDs and then gives step-by-step training on how to make an ER diagram with correct cardinality.
Entity Relationship Diagrams are comprised of 3 main categories: entities, attributes, and relationships. Entities are objects or concepts that are associated with important data—like a customer, order, or product. Attributes represent properties or traits of an entity, such as a customer’s phone number or home address. Relationships demonstrate the link between entities.
Another main aspect of of ERD's is cardinality, which further defines the relationship between entities in a numerical way. Certain symbols signify the minimum and maximum relationship between different entities.
Additional ERD information: lucidchart.com/pages/entity-relationship-diagra…
——
Learn more and sign up:
lucidchart.com/users/register
Follow us:
Facebook: facebook.com/lucidchart
Twitter: twitter.com/lucidchart
Instagram: instagram.com/lucidchart
LinkedIn: linkedin.com/company/lucidsoftware
Learn how to create an Entity Relationship Diagram in this tutorial. We provide a basic overview of ERDs and then gives step-by-step training on how to make an ER diagram with correct cardinality.
Entity Relationship Diagrams are comprised of 3 main categories: entities, attributes, and relationships. Entities are objects or concepts that are associated with important data—like a customer, order, or product. Attributes represent properties or traits of an entity, such as a customer’s phone number or home address. Relationships demonstrate the link between entities.
Another main aspect of of ERD's is cardinality, which further defines the relationship between entities in a numerical way. Certain symbols signify the minimum and maximum relationship between different entities.
Additional ERD information: lucidchart.com/pages/entity-relationship-diagra…
——
Learn more and sign up:
lucidchart.com/users/register
Follow us:
Facebook: facebook.com/lucidchart
Twitter: twitter.com/lucidchart
Instagram: instagram.com/lucidchart
LinkedIn: linkedin.com/company/lucidsoftware
About this tutorial
Lucidchart published this 6:58 video tutorial on October 25, 2017. It has been watched 3,436,991 times on YouTube.
- Channel
- Lucidchart
- Category
- Science & Technology
- Duration
- 6:58
- Published
- October 25, 2017
- Views
- 3,436,991
- Likes
- 43,739
Tags
Share
This tutorial in other languages
- FRDiagramme entité-relation (ERD) Tutorial - Partie 1
- ESDiagrama entidad-relación (ERD) Tutorial - Parte 1
- PTEntity Relationship Diagram (ERD) Tutorial - Parte 1
- ITEntity Relationship Diagram (ERD) Tutorial - Part 1
- DEEntity-Relationship-Diagramm (ERD) Tutorial - Teil 1
- NLEntity Relationship Diagram (ERD) Tutorial - Part 1
- RUEntity Relationship Diagram (ERD) Учебник - Часть 1
- PLPodmiot związku Diagram (ERD) Tutorial - Część 1
- JAエンティティ関係図(ERD)チュートリアル - パート1
- ARكيان مخطط العلاقة (ERD) دروس - الجزء 1
- HIइकाई संबंध आरेख (ERD) ट्यूटोरियल - भाग 1
- IDEntity Relationship Diagram (ERD) Tutorial - Bagian 1