Playback starts YouTube’s embedded player (privacy-enhanced mode).
How to Calculate Total Daily Averages with Pivot Tables
ChannelExcel Campus - JonChapters
Description from the creator
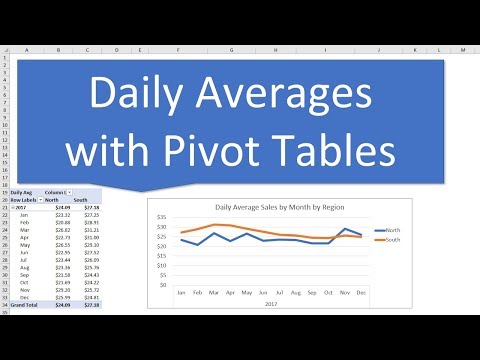
Learn how to calculate the average of a daily total amount across month, quarters, years, or even categories with a pivot table.
Download the Excel file: excelcampus.com/pivot-tables/average-daily-tota…
In this example, the source data contains data for a sales transaction on each row. There are multiple sales per day, and therefore multiple rows with the same date.
This daily average calculation allows us to sum up multiple rows of data for the same date, and find the average trend across weeks, months, quarters, years, etc.
For this technique, we will use the Power Pivot Data Model and DAX Measures. Don't let that scare you, as I explain it all step-by-step.
IMPORTANT: You will need Excel 2013 or later for Windows. That includes an Office 365 subscription. I will post another video in the future on how to do this on Excel 2010, or Excel for Mac.
Here are the 3 measures we create to calculate the Average Daily Sales:
1. Total Sales = SUM([Amount])
2. Distinct Day Count = DISTINCTCOUNT([Date])
3. Daily Average = [Total Sales]/[Distinct Day Count]
The DISTINCTCOUNT function in DAX calculates the distinct count of days for any given filter context in the pivot table. We take Total Sales for the same intersection and divide it by Distinct Count of days (date column) to get the Daily Average.
The great part about this technique is that it works for any time period grouping or even comparison between categories like region, department, etc.
Links mentioned in the video:
Read the full article here: excelcampus.com/pivot-tables/daily-average-calc…
Grouping Dates in Pivot Tables: excelcampus.com/pivot-tables/grouping-dates-piv…
Calendar Tables and Fiscal Calendars: excelcampus.com/tables/calendar-table-explained/
00:00 Introduction
00:19 Average of Total Daily Sales
02:57 Insert a Pivot Table & Add to Data Model
03:59 Create the DAX Measures
04:44 Add the Measures to the Pivot Table
About this tutorial
Excel Campus - Jon published this 10:07 video tutorial on October 25, 2018. It has been watched 240,059 times on YouTube.
- Channel
- Excel Campus - Jon
- Category
- Education
- Duration
- 10:07
- Published
- October 25, 2018
- Views
- 240,059
- Likes
- 1,719
Tags
Share
Further reading
-
How to Calculate Daily Averages with a Pivot Table - Excel Campus
excelcampus.com
The AFTER video contains the solution and sample pivot tables. Pivot Table Daily Averages - Data Model - BEFORE.xlsx (36.0 KB) Pivot Table Daily Averages - Data Model - AFTER.xlsx (235.7 KB) Average of Total Daily Sales…
-
Pivot Table Average of Averages in Grand Total Row
excelcampus.com
The Grand Total average in the pivot table is adding up all of the cells in the quantity column of the data set and dividing it by the total number of orders. The status bar average, however, doesn't take into account t…
-
How to average per day/month/quarter/hour with pivot table in ...
extendoffice.com
In the opening Grouping dialog box, click to highlight the item you want to calculate averages based on in the By box, such as Months, and click the OK button. And then in the pivot table, right click the Sum of Amount…
This tutorial in other languages
- FRComment calculer le total des moyennes journalières avec tableaux croisés dynamiques
- ESCómo Calcular promedios totales diarias con tablas dinámicas
- PTComo Médias Calcular total diário com tabelas dinâmicas
- ITCome Medie Calcolare totale giornalieri con tabelle pivot
- DEWie zu berechnen Tagesgesamt Durchschnitt mit Pivot-Tabellen
- NLHoe te berekenen Totale dagelijkse Gemiddelden met Pivot Tables
- RUКак рассчитать Всего среднесуточных сводные таблицы
- PLJak Średnie Oblicz Razem codziennie tabele przestawne
- JAどのようにピボットテーブルでの計算の合計の毎日の平均値に
- ARكيفية حساب المتوسطات إجمالي اليومية مع الجداول المحورية
- HIकैसे पिवट तालिका के साथ की गणना कुल दैनिक औसत करने के लिए
- IDCara Menghitung Rata-rata Jumlah harian dengan Pivot Tables